Titanic 作为Kaggle中最经典的机器学习入门算法,总结了机器学习的思路
导入数据 1 2 3 import numpy as np import pandas as pd
1 2 3 4 5 6 7 8 import osfor dirname, _, filenames in os.walk('datasets/titanic' ): for filename in filenames: print (os.path.join(dirname, filename))
datasets/titanic\gender_submission.csv
datasets/titanic\test.csv
datasets/titanic\train.csv
简单看一眼数据 1 2 train_data = pd.read_csv("datasets/titanic/train.csv" ) train_data.head()
PassengerId
Survived
Pclass
Name
Sex
Age
SibSp
Parch
Ticket
Fare
Cabin
Embarked
0
1
0
3
Braund, Mr. Owen Harris
male
22.0
1
0
A/5 21171
7.2500
NaN
S
1
2
1
1
Cumings, Mrs. John Bradley (Florence Briggs Th...
female
38.0
1
0
PC 17599
71.2833
C85
C
2
3
1
3
Heikkinen, Miss. Laina
female
26.0
0
0
STON/O2. 3101282
7.9250
NaN
S
3
4
1
1
Futrelle, Mrs. Jacques Heath (Lily May Peel)
female
35.0
1
0
113803
53.1000
C123
S
4
5
0
3
Allen, Mr. William Henry
male
35.0
0
0
373450
8.0500
NaN
S
1 2 test_data = pd.read_csv("datasets/titanic/test.csv" ) test_data.head()
PassengerId
Pclass
Name
Sex
Age
SibSp
Parch
Ticket
Fare
Cabin
Embarked
0
892
3
Kelly, Mr. James
male
34.5
0
0
330911
7.8292
NaN
Q
1
893
3
Wilkes, Mrs. James (Ellen Needs)
female
47.0
1
0
363272
7.0000
NaN
S
2
894
2
Myles, Mr. Thomas Francis
male
62.0
0
0
240276
9.6875
NaN
Q
3
895
3
Wirz, Mr. Albert
male
27.0
0
0
315154
8.6625
NaN
S
4
896
3
Hirvonen, Mrs. Alexander (Helga E Lindqvist)
female
22.0
1
1
3101298
12.2875
NaN
S
用原始的方法看一下性别对幸存的影响 1 2 3 4 women = train_data.loc[train_data.Sex == 'female' ]["Survived" ] rate_women = sum (women)/len (women) print ("% of women who survived:" , rate_women)
% of women who survived: 0.7420382165605095
1 2 3 4 men = train_data.loc[train_data.Sex == 'male' ]["Survived" ] rate_men = sum (men)/len (men) print ("% of men who survived:" , rate_men)
% of men who survived: 0.18890814558058924
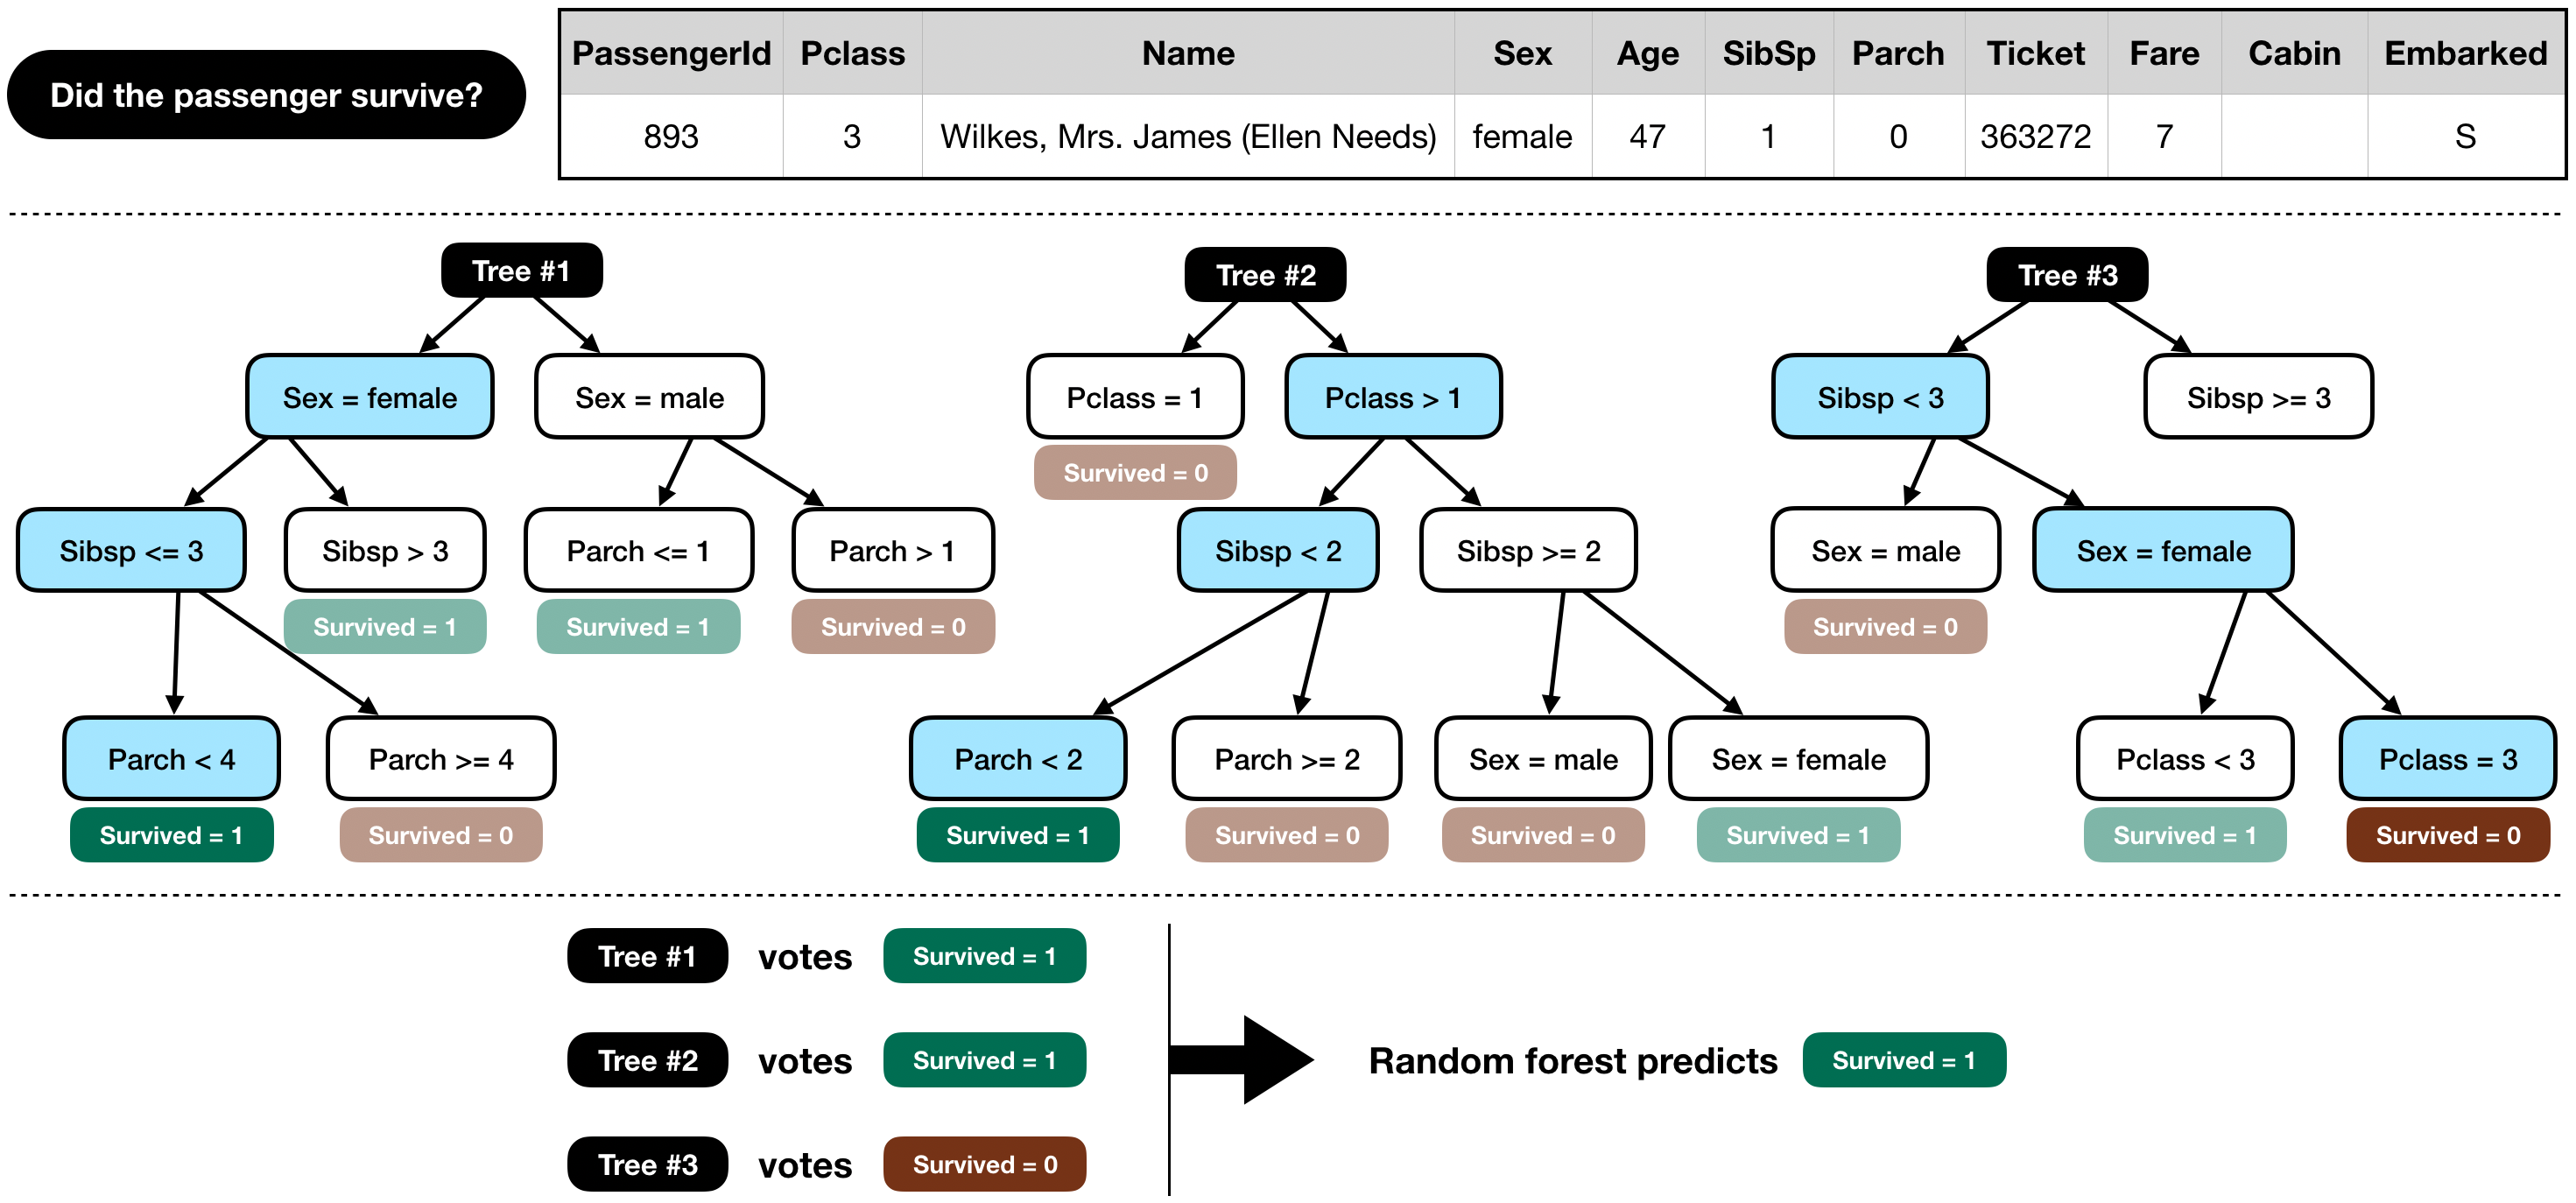
使用决策树的方式对数据进行预测 原理如下
1 2 3 4 5 6 7 8 9 10 11 12 13 14 15 16 from sklearn.ensemble import RandomForestClassifiery = train_data["Survived" ] features = ["Pclass" , "Sex" , "SibSp" , "Parch" ] X = pd.get_dummies(train_data[features]) X_test = pd.get_dummies(test_data[features]) model = RandomForestClassifier(n_estimators=100 , max_depth=5 , random_state=1 ) model.fit(X, y) predictions = model.predict(X_test) output = pd.DataFrame({'PassengerId' : test_data.PassengerId, 'Survived' : predictions}) output.to_csv('submission.csv' , index=False ) print ("Your submission was successfully saved!" )
Your submission was successfully saved!
1 train_data.describe(include='all' )
PassengerId
Survived
Pclass
Name
Sex
Age
SibSp
Parch
Ticket
Fare
Cabin
Embarked
count
891.000000
891.000000
891.000000
891
891
714.000000
891.000000
891.000000
891
891.000000
204
889
unique
NaN
NaN
NaN
891
2
NaN
NaN
NaN
681
NaN
147
3
top
NaN
NaN
NaN
Braund, Mr. Owen Harris
male
NaN
NaN
NaN
347082
NaN
B96 B98
S
freq
NaN
NaN
NaN
1
577
NaN
NaN
NaN
7
NaN
4
644
mean
446.000000
0.383838
2.308642
NaN
NaN
29.699118
0.523008
0.381594
NaN
32.204208
NaN
NaN
std
257.353842
0.486592
0.836071
NaN
NaN
14.526497
1.102743
0.806057
NaN
49.693429
NaN
NaN
min
1.000000
0.000000
1.000000
NaN
NaN
0.420000
0.000000
0.000000
NaN
0.000000
NaN
NaN
25%
223.500000
0.000000
2.000000
NaN
NaN
20.125000
0.000000
0.000000
NaN
7.910400
NaN
NaN
50%
446.000000
0.000000
3.000000
NaN
NaN
28.000000
0.000000
0.000000
NaN
14.454200
NaN
NaN
75%
668.500000
1.000000
3.000000
NaN
NaN
38.000000
1.000000
0.000000
NaN
31.000000
NaN
NaN
max
891.000000
1.000000
3.000000
NaN
NaN
80.000000
8.000000
6.000000
NaN
512.329200
NaN
NaN

